By DocMBS Billing Team · Last updated: October 2026
If you price a Medicare Part A stay from the wrong rate table, every number after it is wrong: your revenue projection, your expected payment and your underpayment checks. That is why the SNF PDPM urban vs rural rates matter. CMS publishes two separate sets of rates, and your facility’s location decides which set applies.
This guide shows both sets of FY 2027 rates side by side, explains why they differ, and walks through the math for the same resident in an urban and a rural facility. For the full update, see our guide to FY 2027 SNF Medicare daily rates.
Quick Answer
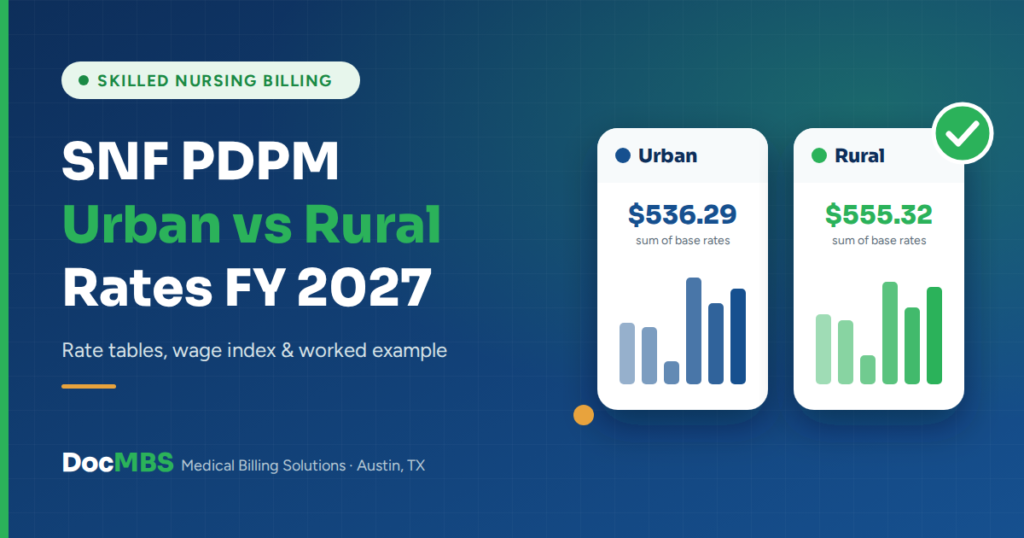
For FY 2027 (effective October 1, 2026), rural SNFs get higher base rates for PT, OT, SLP and non-case-mix, while urban SNFs get higher nursing and NTA rates. The six unadjusted rates add up to $536.29 urban and $555.32 rural. Your wage index then moves the final rate up or down.
Table of Contents
- FY 2027 SNF PDPM Rates at a Glance
- SNF Urban Rate FY 2027: Unadjusted Federal Per Diem Rates
- SNF Rural Rate FY 2027: Unadjusted Federal Per Diem Rates
- SNF PDPM Urban vs Rural Rates Side by Side
- Why Urban and Rural Rates Are Different
- How to Check Whether Your Facility Is Urban or Rural
- How the Wage Index and Labor-Related Share Adjust the Rate
- Worked Example: Same Resident, Urban vs Rural Facility
- How to Read the CMS Final Rule Rate Tables
- Variable Per Diem Adjustment
- Common Mistakes and How to Fix Them
- What This Means for SNF Billing and Revenue
- Key Takeaways
- FAQs
- Sources
FY 2027 SNF PDPM Rates at a Glance
CMS set the FY 2027 rates in the SNF PPS final rule (CMS-1843-F), issued July 29, 2026 and published in the Federal Register on July 31, 2026.
| Item | FY 2027 |
|---|---|
| Effective dates | October 1, 2026 – September 30, 2027 |
| Net payment update | 2.4% (3.3% market basket minus 0.9 point productivity adjustment) |
| Sum of urban unadjusted rates | $536.29 |
| Sum of rural unadjusted rates | $555.32 |
| Labor-related share | 72.0% |
| Wage index budget neutrality factor | 0.9989 (already built into the rates) |
| Cap on wage index decreases | 5% per year |
“Unadjusted” means the rate before three things are applied: the resident’s case-mix group, the variable per diem adjustment and your wage index. Nobody is paid the unadjusted rate as it stands.
SNF Urban Rate FY 2027: Unadjusted Federal Per Diem Rates
This is Table 3 of the final rule. Use it if your facility is in an urban area.
| PDPM component | FY 2026 | FY 2027 urban rate |
|---|---|---|
| Physical Therapy (PT) | $75.73 | $77.46 |
| Occupational Therapy (OT) | $70.49 | $72.10 |
| Speech-Language Pathology (SLP) | $28.28 | $28.93 |
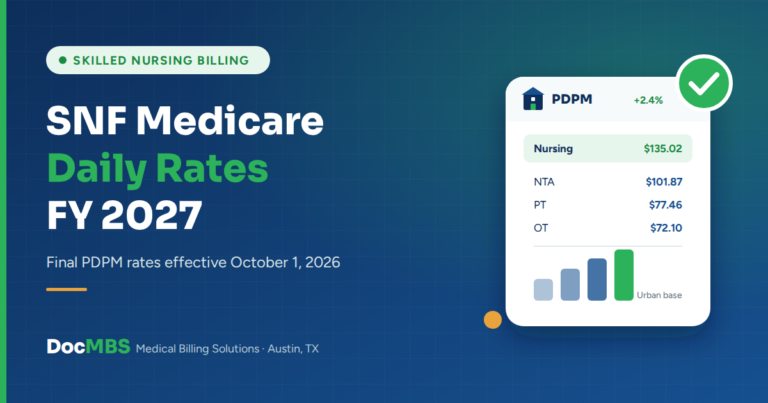
| Nursing | $132.00 | $135.02 |
| Non-Therapy Ancillaries (NTA) | $99.59 | $101.87 |
| Non-Case-Mix | $118.21 | $120.91 |
| Sum | $524.30 | $536.29 |
SNF Rural Rate FY 2027: Unadjusted Federal Per Diem Rates
This is Table 4 of the final rule. Use it if your facility is in a rural area. It also applies to non-critical-access swing-bed hospitals paid under the SNF PPS.
| PDPM component | FY 2026 | FY 2027 rural rate |
|---|---|---|
| Physical Therapy (PT) | $86.33 | $88.30 |
| Occupational Therapy (OT) | $79.29 | $81.10 |
| Speech-Language Pathology (SLP) | $35.63 | $36.44 |
| Nursing | $126.12 | $129.00 |
| Non-Therapy Ancillaries (NTA) | $95.15 | $97.33 |
| Non-Case-Mix | $120.40 | $123.15 |
| Sum | $542.92 | $555.32 |
Source for both tables: CMS-1843-F, Tables 3 and 4. Rates reflect the 2.4% update and the 0.9989 wage index budget neutrality factor.
SNF PDPM Urban vs Rural Rates Side by Side
Here is the difference for each component. A plus sign means the rural rate is higher.
| Component | Urban | Rural | Difference (rural minus urban) | Higher in |
|---|---|---|---|---|
| PT | $77.46 | $88.30 | +$10.84 (14.0%) | Rural |
| OT | $72.10 | $81.10 | +$9.00 (12.5%) | Rural |
| SLP | $28.93 | $36.44 | +$7.51 (26.0%) | Rural |
| Nursing | $135.02 | $129.00 | −$6.02 (4.5%) | Urban |
| NTA | $101.87 | $97.33 | −$4.54 (4.5%) | Urban |
| Non-Case-Mix | $120.91 | $123.15 | +$2.24 (1.9%) | Rural |
| Sum | $536.29 | $555.32 | +$19.03 | Rural |
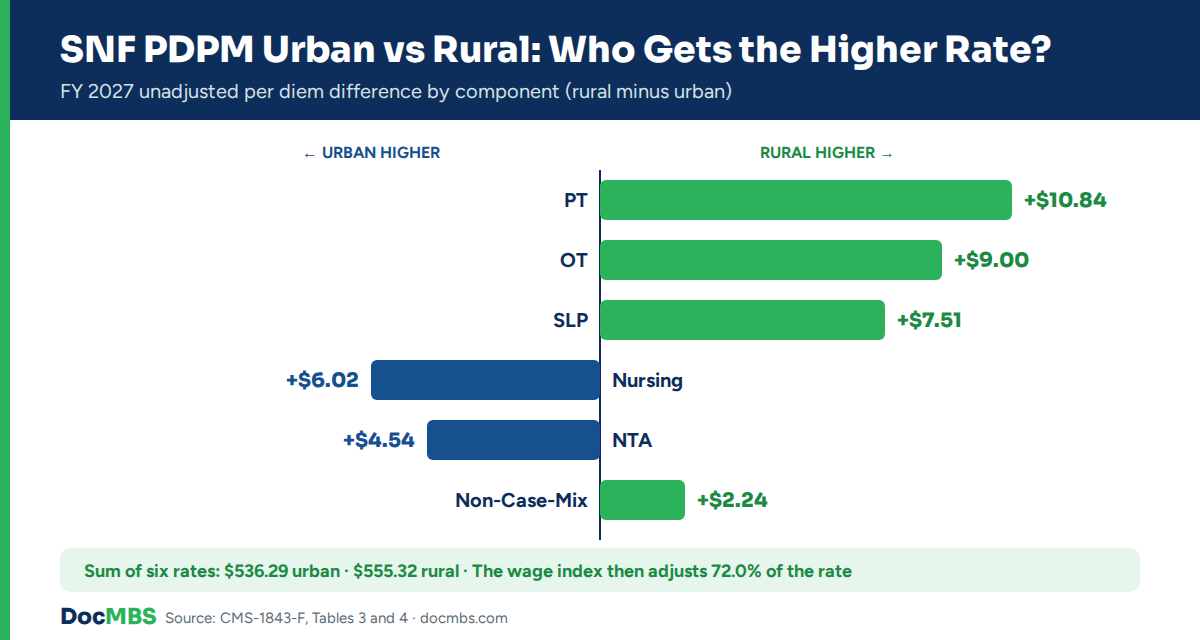
Watch Out: A higher rural base rate does not mean rural facilities are paid more. Nursing and NTA carry the largest case-mix weights, and both are lower in the rural table. On top of that, the wage index is applied to 72% of the rate. A low wage index can wipe out the rural advantage.
Why Urban and Rural Rates Are Different
The SNF PPS base rates go back to SNF cost reports from fiscal year 1995. CMS built the federal rates from those costs and, as the final rule explains, computed the rates separately for urban and rural facilities. Each year since, both sets have been updated by the same percentage.
So the gap you see today is not a bonus or a penalty set this year. It reflects how costs were split between urban and rural facilities in the base data, carried forward with yearly updates.
Why is the rural nursing rate lower?
In the FY 2027 rule, several commenters asked CMS why the rural nursing rate ($129.00) is lower than the urban one ($135.02), given nursing shortages in rural areas. CMS said it will consider the issue in future rulemaking and finalized the rates as proposed. For now, the gap stays.
How to Check Whether Your Facility Is Urban or Rural
CMS uses Core-Based Statistical Areas (CBSAs) from the Office of Management and Budget. A facility in a county that belongs to a Metropolitan Statistical Area is urban. A facility in any other county is rural. The SNF PPS currently uses the delineations in OMB Bulletin No. 23-01, and CMS kept them unchanged for FY 2027.
- Confirm the county where the facility is physically located. Use the service location, not a corporate or billing address.
- Open the CMS SNF PPS Wage Index page and download the “CMS-1843-F Wage Index Tables FY 2027 – Final” file.
- Find your county’s CBSA. Table A lists urban areas by CBSA. Table B lists rural areas by state.
- Note your status and wage index. If your county appears under a CBSA in Table A, you are urban. If not, you use your state’s rural wage index from Table B.
- Compare with last year. If your wage index fell by more than 5%, the cap limits the drop. Confirm your MAC applied the capped value.
- Match your billing system. Check that the CBSA code and rate table loaded in your software match what you found.
Pro Tip: Being in a small town does not make a facility rural for Medicare. Many small-town SNFs sit in counties that are part of a metropolitan area, and they are paid from the urban table. Always check the county, never the town size.
How the Wage Index and Labor-Related Share Adjust the Rate
After you add up the resident’s case-mix adjusted components, CMS adjusts the total for local wages:
- 72.0% of the daily rate is the labor portion in FY 2027.
- The labor portion is multiplied by your wage index.
- The other 28.0% is not adjusted.
In formula form: Adjusted rate = (Rate × 0.72 × Wage index) + (Rate × 0.28)
A wage index of 1.00 leaves the rate unchanged. Below 1.00 lowers it, and above 1.00 raises it. Because the labor share is so large, a small change in the wage index moves real money. On a $800 daily rate, every 0.01 of wage index is worth about $5.76 per day ($800 × 0.72 × 0.01).
Not sure your SNF is being paid from the right rate table?
DocMBS checks your CBSA, wage index and HIPPS codes against the FY 2027 final rule, then compares your Medicare payments line by line. If you are being underpaid, we find it.
Worked Example: Same Resident, Urban vs Rural Facility
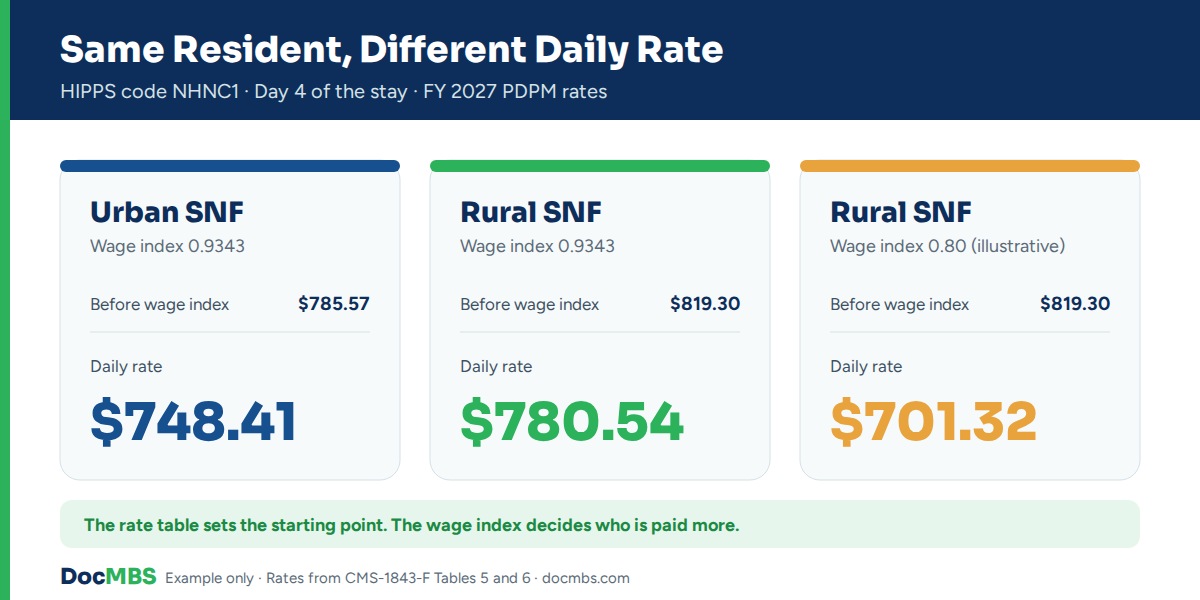
Example only. The facilities are fictional. One resident has HIPPS code NHNC1, the same code CMS uses in the final rule’s own example. We price day 4 of the stay, when no variable per diem adjustment applies yet, at an urban facility and a rural facility.
Step 1: Look up the case-mix adjusted rates
Urban rates come from Table 5 and rural rates from Table 6 of the final rule.
| Component (group) | Urban rate | Rural rate |
|---|---|---|
| PT (N) | $108.44 | $123.62 |
| OT (N) | $102.38 | $115.16 |
| SLP (H) | $78.11 | $98.39 |
| Nursing (CBC2) | $198.48 | $189.63 |
| NTA (C) | $177.25 | $169.35 |
| Non-case-mix | $120.91 | $123.15 |
| Total before wage index | $785.57 | $819.30 |
Before the wage index, the rural facility is ahead by $33.73 per day for this resident.
Step 2: Apply the wage index
The urban facility uses a wage index of 0.9343, the value in the CMS example. For the rural facility we show two cases: the same 0.9343, and an illustrative 0.80. The 0.80 is not a real area’s value. It is there to show the effect.
| Step | Urban (WI 0.9343) | Rural (WI 0.9343) | Rural (WI 0.80, illustrative) |
|---|---|---|---|
| Total before wage index | $785.57 | $819.30 | $819.30 |
| Labor portion (× 72.0%) | $565.61 | $589.90 | $589.90 |
| Labor × wage index | $528.45 | $551.14 | $471.92 |
| Non-labor portion (28.0%) | $219.96 | $229.40 | $229.40 |
| Day 4 rate | $748.41 | $780.54 | $701.32 |
What this shows: With the same wage index, the rural facility is paid $32.13 more per day for this resident. With a wage index of 0.80, it is paid $47.09 less than the urban facility. The table you use matters, and the wage index matters even more.
On days 1–3 the NTA component is tripled. That brings the urban day 1–3 rate to $1,086.14, which matches Table 9 of the final rule, and the rural rate at the same wage index to $1,103.22.
How to Read the CMS Final Rule Rate Tables
Search data shows many billers look for “table 4 and 5” without knowing what each one holds. Here is the map for the FY 2027 final rule.
| Table | What it shows | When you use it |
|---|---|---|
| Table 3 | Urban unadjusted federal per diem rates | To see urban base rates by component |
| Table 4 | Rural unadjusted federal per diem rates | To see rural base rates by component |
| Table 5 | Urban case-mix adjusted rates and case-mix indexes | To price a resident in an urban SNF |
| Table 6 | Rural case-mix adjusted rates and case-mix indexes | To price a resident in a rural SNF |
| Table 7 | Labor-related share (72.0%) | To split labor and non-labor |
| Tables 8–10 | CMS’s worked payment example | To check your own math |
Reading Tables 5 and 6
- The first column is a letter. It matches a character in the resident’s HIPPS code.
- The 1st HIPPS character gives the PT and OT group, the 2nd the SLP group, the 3rd the nursing group and the 4th the NTA group.
- For each letter, the table shows the case-mix index (CMI) and the dollar rate. The rate is simply the base rate × CMI. Example: urban PT group N is $77.46 × 1.40 = $108.44.
- Add the five rates, then add the non-case-mix amount from Table 3 or 4.
Table numbers can change from year to year. Always confirm the table title, not just the number, when you move to a new fiscal year’s rule.
Variable Per Diem Adjustment: How PT, OT and NTA Rates Change During the Stay
Three components do not stay flat for the whole stay. The adjustment factors are the same for urban and rural facilities.
| Component | Days of the stay | Adjustment factor |
|---|---|---|
| NTA | 1–3 | 3.00 |
| NTA | 4–100 | 1.00 |
| PT and OT | 1–20 | 1.00 |
| PT and OT | 21–27 | 0.98 |
| PT and OT | 28–34 | 0.96 |
| PT and OT | Each 7 days after | Drops another 0.02 |
SLP, nursing and the non-case-mix component are not adjusted. Because rural PT and OT rates are higher, the 2% steps take slightly more dollars from a rural rate than from an urban one.
Common Mistakes and How to Fix Them
| Mistake | What happens | How to fix it |
|---|---|---|
| Using the urban table for a rural facility, or the reverse | Every expected payment is off, so real underpayments are hidden | Confirm your county’s status in the FY 2027 wage index file, then reload the correct table |
| Old wage index still loaded | Each October claim shows a small variance | Update the wage index every October 1 and check the 5% cap |
| Wrong CBSA after a move or new location | Wrong wage index and possibly the wrong table | Use the county where care is delivered; update CBSA when a site changes |
| Ignoring the variable per diem adjustment | Forecasts overstate revenue after day 3 and day 20 | Build the NTA and PT/OT factors into your projection by day of stay |
| Applying the wage index to 100% of the rate | Rate is overstated or understated | Apply it only to the 72.0% labor portion |
| Still using FY 2026 or proposed-rule rates | Rates are short by about 2.3% or off by cents | Load Tables 3–6 from the final rule |
On the SNF claims we review, the most common error is the simplest one: the billing system was never updated on October 1, so the facility compares new payments against last year’s rates for months.
What This Means for SNF Billing and Revenue
- HIPPS code accuracy. The table only gives the right rate if the HIPPS code is right. One wrong character changes a component rate, in either table.
- MDS coding. The HIPPS code comes from the MDS. Diagnoses, function scores and NTA comorbidities must be documented and coded correctly, because nursing and NTA carry the most dollars.
- Consolidated billing. The per diem covers almost all services during a Part A stay. Paying outside vendors for services that should be inside the rate eats into it, whether you are urban or rural.
- Revenue projections. Build your budget from the correct table, your own wage index and the variable per diem schedule, not from a national average.
If you’d like a team that checks all of this on every claim, see our medical billing and RCM services. For the full FY 2027 update, including QRP and coinsurance, read our guide to FY 2027 SNF Medicare daily rates.
Key Takeaways
- FY 2027 rates run from October 1, 2026 to September 30, 2027 and rose 2.4%.
- Unadjusted rates add up to $536.29 urban and $555.32 rural.
- Rural is higher for PT, OT, SLP and non-case-mix. Urban is higher for nursing and NTA.
- Your county’s CBSA decides whether you are urban or rural, not the size of your town.
- The wage index applies to 72.0% of the rate and often matters more than the table.
- Tables 3 and 4 hold base rates; Tables 5 and 6 hold the case-mix adjusted rates you price from.
FAQs
What is the SNF urban rate for FY 2027?
The FY 2027 urban unadjusted federal per diem rates are $77.46 for PT, $72.10 for OT, $28.93 for SLP, $135.02 for nursing, $101.87 for NTA and $120.91 for non-case-mix. Together they total $536.29 per day before case-mix, variable per diem and wage index adjustments. They apply from October 1, 2026.
What is the difference between urban and rural SNF rates?
Rural rates are higher for PT (+$10.84), OT (+$9.00), SLP (+$7.51) and non-case-mix (+$2.24). Urban rates are higher for nursing (+$6.02) and NTA (+$4.54). The rural total is $19.03 higher at $555.32, but the wage index can change which facility is actually paid more.
How do I know if my facility is urban or rural?
Find the county where the facility is located, then look it up in the CMS FY 2027 SNF wage index tables. If the county belongs to an urban CBSA in Table A, the facility is urban. If it does not, the facility is rural and uses its state’s rural wage index from Table B.
What do the rate tables in the SNF PPS final rule show?
In the FY 2027 final rule, Table 3 lists urban unadjusted rates and Table 4 lists rural unadjusted rates. Table 5 gives urban case-mix adjusted rates and Table 6 gives rural ones. Table 7 shows the labor-related share, and Tables 8 to 10 show a worked payment example.
How does the wage index change my PDPM rate?
CMS multiplies 72.0% of the resident’s daily rate by your area’s wage index and leaves the other 28.0% unchanged. A wage index under 1.00 lowers the rate and one above 1.00 raises it. A facility’s wage index cannot fall more than 5% from the prior year.
Why is the rural nursing rate different from the urban rate?
CMS built urban and rural base rates separately from historical SNF cost data and has updated both by the same percentage each year. That left the rural nursing rate lower: $129.00 versus $135.02 in FY 2027. CMS said it will consider commenters’ concerns about this gap in future rulemaking.
How do I calculate my facility’s daily rate under PDPM?
Use the HIPPS code to find each component’s rate in Table 5 (urban) or Table 6 (rural). Apply the variable per diem factors, add the non-case-mix rate, multiply 72.0% of the total by your wage index and add back the other 28.0%. Then account for SNF VBP and coinsurance.
Price Every Stay From the Right Table
The SNF PDPM urban vs rural rates come down to three checks: the right table for your county, the current wage index and the right HIPPS code. Get those right and your projections and underpayment checks will hold up.
DocMBS works SNF claims every day and can verify your FY 2027 setup for you. Book a free SNF billing review and we’ll compare your Medicare payments against the correct rates.
Sources
- Federal Register: FY 2027 SNF PPS Final Rule (CMS-1843-F), Tables 3–10, published July 31, 2026
- CMS Fact Sheet: Fiscal Year 2027 SNF PPS Final Rule, July 29, 2026
- CMS: SNF PPS Wage Index (FY 2027 final tables)
- CMS: Skilled Nursing Facility PPS
Last updated: October 2026. This article is for education only and is not reimbursement or legal advice. Confirm all rates and your wage index with CMS or your MAC before billing or budgeting.
Talk to our billing team
Book an appointment and discuss your practice's billing with a DocMBS specialist.